Dashboard
After logging in, the StoryPRO dashboard is the landing page, providing a comprehensive overview of your platform's performance. The screen is divided into several quadrants to facilitate easy viewing and analysis.
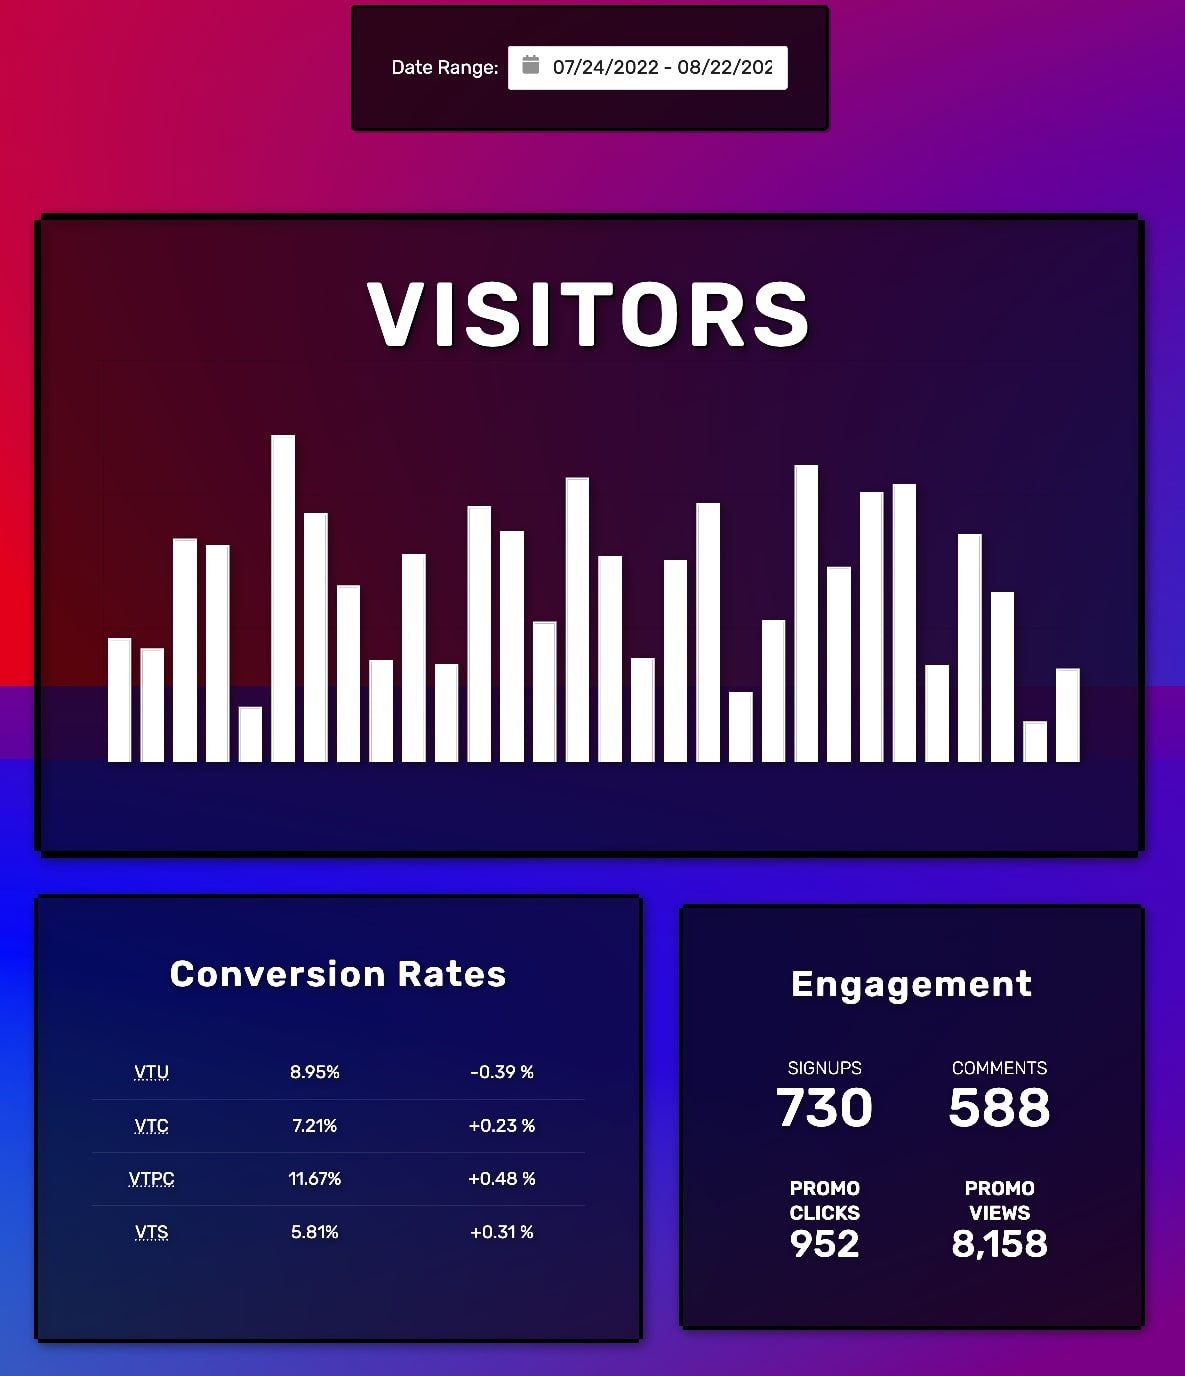
Traffic Quadrant
This quadrant provides valuable insight into your traffic patterns, allowing you to track your platform's growth over time. The data displayed by default is for the last seven days, but you can choose from other options or set your custom period. Use the date filters to focus on a specific period.
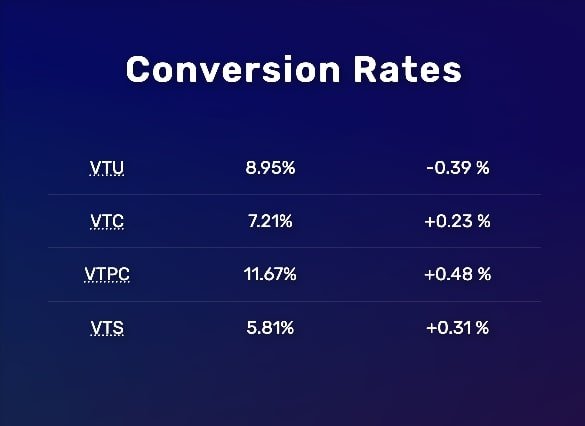
Visitor Conversion Quadrant
The visitor conversion table displays your conversion metrics across several areas. Percentages are based on the number of visitors during the selected time period. You can monitor these percentages to determine which content most engages visitors and encourages them to sign up.
Visitors to Users - The percentage of visitors who converted to users by signing up on the platform.
Visitors to Comments - The percentage of platform visitors who commented on a piece of content.
Visitors to Newsletter Subscribers - The percentage of visitors who subscribed to a newsletter by submitting their email.
Visitors to Promo Clicks - The percentage of visitors who clicked on a promotion.
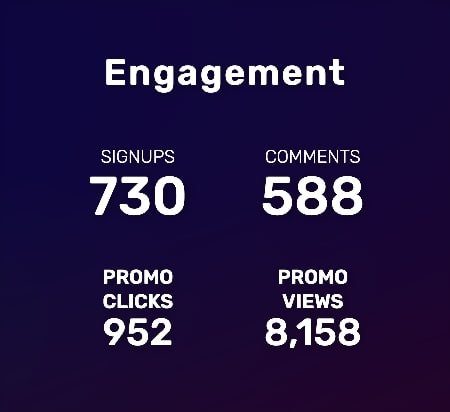
Visitor Engagement Quadrant
The visitor engagement statistics display the total number of signups, comments, newsletter subscriptions, and native ad views. This quadrant provides a snapshot of how engaged your visitors are and how successful your platform retains them.
The StoryPRO dashboard lets you quickly and efficiently track your platform's performance and make data-driven decisions to optimize its growth.